


Seabornで相関行列の可視化
import numpy as np
import pandas as pd
import matplotlib.pyplot as pat
import seaborn as sns

%matplotlib inline
#ファイルの読み込み
X = pd.pd.read_csv('ファイル名')

#相関係数行列を求める
corrmat = X.corr()

#seabornで可視化する
f, ax = plt.subplots(figsize=(20, 9))
sns.heatmap(corrmat, vmax=.8, annot=True);
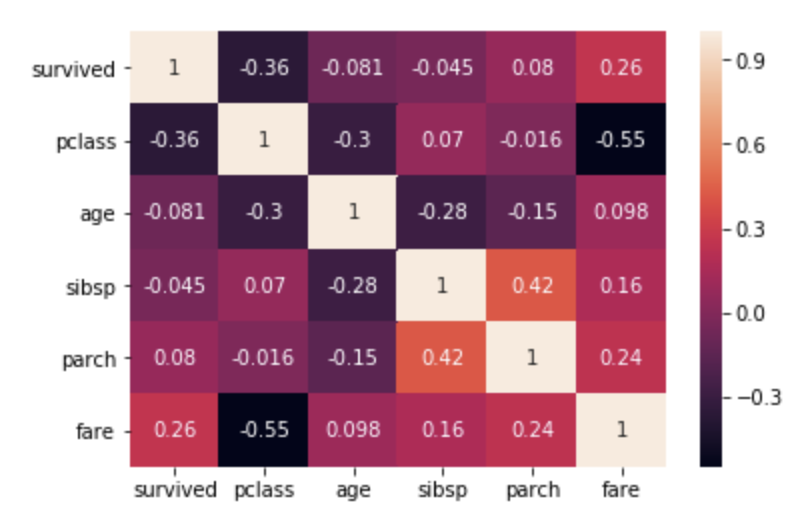
出力結果
出力は、下のようになります。
相関関係が見やすく、自動的にグラフ化してくれます。
相関が高いものを抽出
target(被説明変数)との相関係数が大きいものを抽出します。
threshold(閾値)を設定して、それ以上のindexを抽出します。
相関係数が大きいと、その変数間で関連性が高いが予想できます。
threshold = 0.5
corrmat = train.corr()

top_corr_features = corrmat.index[abs(corrmat["target"]) > threshold]

sns.heatmap(X[top_corr_features].corr(),annot=True)