matplotlibまとめ
グラフの種類
| 種類 | 書き方 | 用途 |
|---|---|---|
| 折れ線グラフ | plt.plot() | |
| 棒グラフ | plt.bar() | |
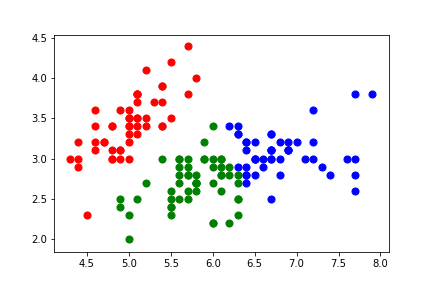
| 散布図 | plt.scatter() |
グラフの設定関連
図の大きさの設定
plt.figure(figsize=(横, 縦)
複数プロット
plt.subplot(行, 列, 場所)
凡例の設定
plt.legend()
位置の調節
参考:matplotlib の legend(凡例) の 位置を調整する
plt.legend(bbox_to_anchor, loc, borderaxespad, fontsize)
bbox_to_anchor:左下を(0,0)、右上を(1,1)とした時の座標を与える。
loc:bbox_to_anchorで設定した座標をどこで合わせるかを指定
‘best’, ‘upper right’, ‘upper left’, ‘lower left’, ‘lower right’, ‘right’, ‘center left’, ‘center right’, ‘lower center’, ‘upper center’, ‘center’
borderaxespad:空白の設定
タイトル
plt.title()
軸のラベル
plt.xlabel()
plt.ylabel()
軸の表示範囲
plt.xlim(最小, 最大)
plt.ylim(最小, 最大)
罫線
plt.grid()
軸を削除する
plt.tick_params(labelbottom = False,
                labelleft = False,
                labelright = False,
                labeltop = False)
目盛りを削除する
plt.tick_params(bottom = False,
                left = False,
                right = False,
                top = False)
枠線を削除する
plt.gca().spines['bottom'].set_visible(False)
plt.gca().spines['left'].set_visible(False)
plt.gca().spines['right'].set_visible(False)
plt.gca().spines['top'].set_visible(False)
図を消す
plt.cla()

plt.clf()

plt.close()


